Using Datasette as an engine for BI
By Jonathan A.
The beginning
I’m recently needed to implement a Business Intelligence (BI) layer for a client. By ‘Business Intelligence’ I mean the capacity to extract data in real time about my client’s business and present it on a suitable way. I know this may be a rather vague usage of the term, but for this use case I needed to deliberately ommit the details of a ‘standard’ data pipeline. I will now give some context for what I mean whith ‘standard data pipeline’.
During my college courses in Software Engineering, one of my professors (and old school guy who worked on COBOL systems) taught us how to do the whole process the way he does it. It involved a distributed sistem with a ETL process orchastrated with Pentaho Spoon, then making an OLAP Cube with the Schema Workbench and then publishing it on the pentaho server. I remember that the version we where using in class had to be downloaded from Sourceforge. Told you that the man was old school.
The scenario that was described by my professor illustrates what I understand by a ‘standard data pipeline’. It uses some jargon like ETL, Data Warehaouse, OLAP cube, and so on. I will try to synthesize it in the following diagram, without getting into much detail:
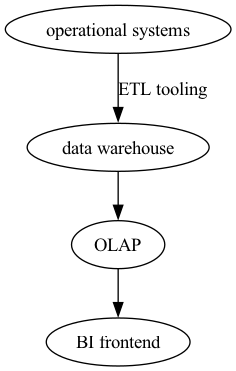
The plot
This approach assumes that there is a seperation between the operational system, or online transaction processing (OLTP) and the online analitical processing (OLAP). This means that there are at least two databases and one transformation process that has the OLTP as input and OLAP as output.
The problem with this approach is that in this project I’m working as the solo full stack developer and I’m running on a Apache-Django-Postgres web application. My biggest concern was that I would have to maintain more moving parts on the production server other than the apache server and my Django project. That is, I would have to add the component for the ETL and the component for the OLAP, as well as the frontend tool itself. For the scale and dimension of the project that seem as an awful lot. “There had to be a better way.”
I had tried to circumvent this dilemma on the past using packages like the incredibly usefull django-admin-charts. However, this package didn´t gave me the flexibility I needed because charts (at least to the extent that I got it working) rely on the structure of the database Django tables. In my use case, which has a particularly cumbersome relations between tables, I needed to denormalize some tables, make joins etc.
The solution
¿So what could possibly save me on this predicament? Turns out the co-creator of Django, Simon Willison had written a relatively new (first release 2017) open source project, Datasette. This excellent project allows ’exploratory data analysis’, ‘instant data publishing’ and ‘rapid prototyping’.
This project is aimed at data journalism and the stock Datasette package uses a SQlite database because it fits perfectly with that usecase. However, the biggest surprise was yet to come, because after fiddling with Datasette I noticed there is a related tool: django-sql-dashboard.
`Django-sql-dashboard` is a Django app with a subset of the Datasette. As a Django app, is integrated with the database and other niceties (such as the permissions system). The killer feature of `django-sql-dasboard` is that is not limited to SQlite. It connects to the database through Django. That means that you can have Datasette exploration and querying alongside Postgres. Effectively, you can now have a Business Intellence process that looks like this:
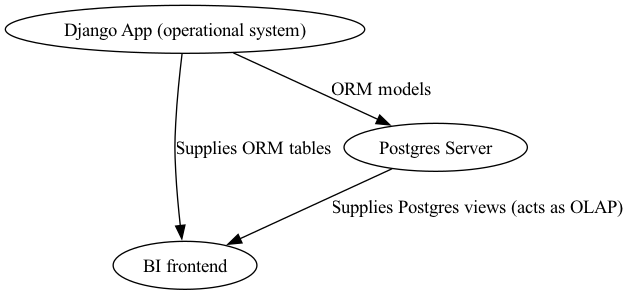
Note that I only separate the Django App and BI frontend on the diagram for conceptual clarity. However the BI frontend is a Django View accesible with a specific url such as `www.app.client.com/dashboard/sales-yearly`.
The caveat
So, do I think I have discovered something new? Of course not, I am aware that the standard data pipeline separates the OLTP and the OLAP system for very weighty reasons. For example, Carlo Vercellis in Business Intelligence: Data Mining and Optimization for Decision Making enumerates some: 1) Integration, 2) Quality 3) Efficiency, 4) Extendability, 5) Entity-oriented, 6) Integrated, 7) Time-variant, 8) Persistent, 9) Consolidated and 10) Denormalized.
Of these reasons, the one that posed a particularly difficult trade-off was Efficiency. I was worried that my reliance on Postgres Views (not even Materialized Views) will result on an appreciable slugishness. However, for the dimension of the data (283 Mb), we couldn’t percieve any of it.
In general, for the requirements I had, this proved to be a really oustanding solution. I recommend it under similar circumstances:
- The OLTP is a single stack (everything is in one server)
- You are working with small data
- Flexibility of exploration is valued over nice dynamic graphs